Embedded debug of firmware (C and Rust)
Notes on how to get both C and Rust debugging working "nicely".
Building properly
The #1 hassle in embedded debug is proper build because it is very easy to run out of flash space. Size optimizations on the other hand go against comfort or usability of debug.
Therefore it's usually hard to make a single profile or setting, but best way is to start with is probably these build options:
make PYOPT=0 BITCOIN_ONLY=1 V=1 VERBOSE=1 OPTIMIZE=-Og build_firmware
Options mean:
PYOPT=0- enable debuglink and testV=1 VERBOSE=1- just more of a check to see it's building with options you wantBITCOIN_ONLY=1- most of the time for C/Rust parts you don't need other coins and it saves space on flash to be usable for other than-OsoptimizationOPTIMIZE=-Og- optimization of C better suited for debug, but it will be larger than default-Os
Micropython has its own optimization setting, so if you need to step through its code as well, set it separately in its build.
Another way to save space in case build overflows flash is changing -fstack-protector-all to
-fstack-protector-strong or -fstack-protector-explicit temporarily for debugging in
SConscript.firmware.
Debug info is enabled for C and Rust in the flags and profiles (stripped when generating the .bin final image).
Putting it into debugger
Once you have built and flashed the FW, configure debugger for remote debug.
General background into remote debug and instructions
for basic arm-none-eabi-gdb and VSCode are listed here.
Below are instructions for CLion with Rust plugin.
So far CLion seems the most complete implementation for ARM embedded debug, but these evolve quickly now.
Though all debuggers will have some historic limitations (especially some watch expressions and return values).
Start OpenOCD/JLink GDB server in a terminal
Depending on your SWD adapter, either (change speed up to 50000 depending on adapter)
JLinkGDBServerCLExe -select USB -device STM32F427VI -endian little -if SWD -speed 4000 -LocalhostOnly
or with openocd (best to use latest from git)
openocd -f interface/stlink.cfg -f target/stm32f4x.cfg
Set up a debug configuration as remote debug
Default port for "target remote" JLink GDB server is :2331, for openocd :3333
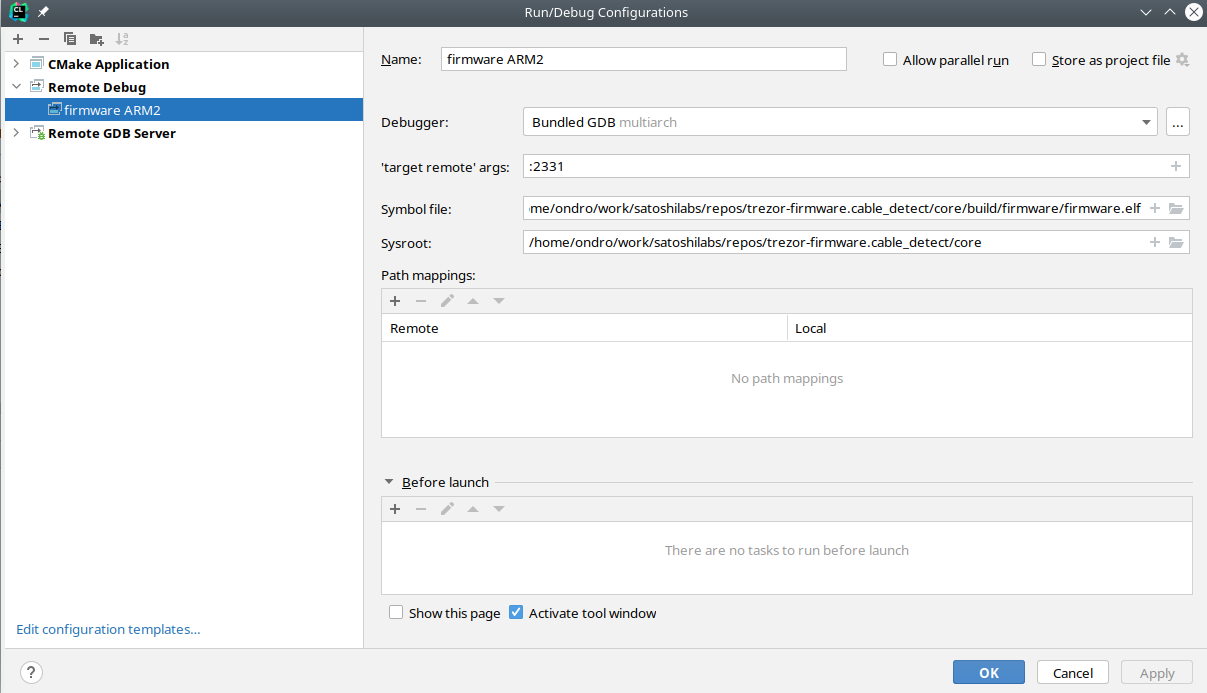
It should be also possible to use "Remote GDB Server" setting and let CLion execute openocd or JLink GDB server.
Now you can see variables from both Rust and C, set breakpoints
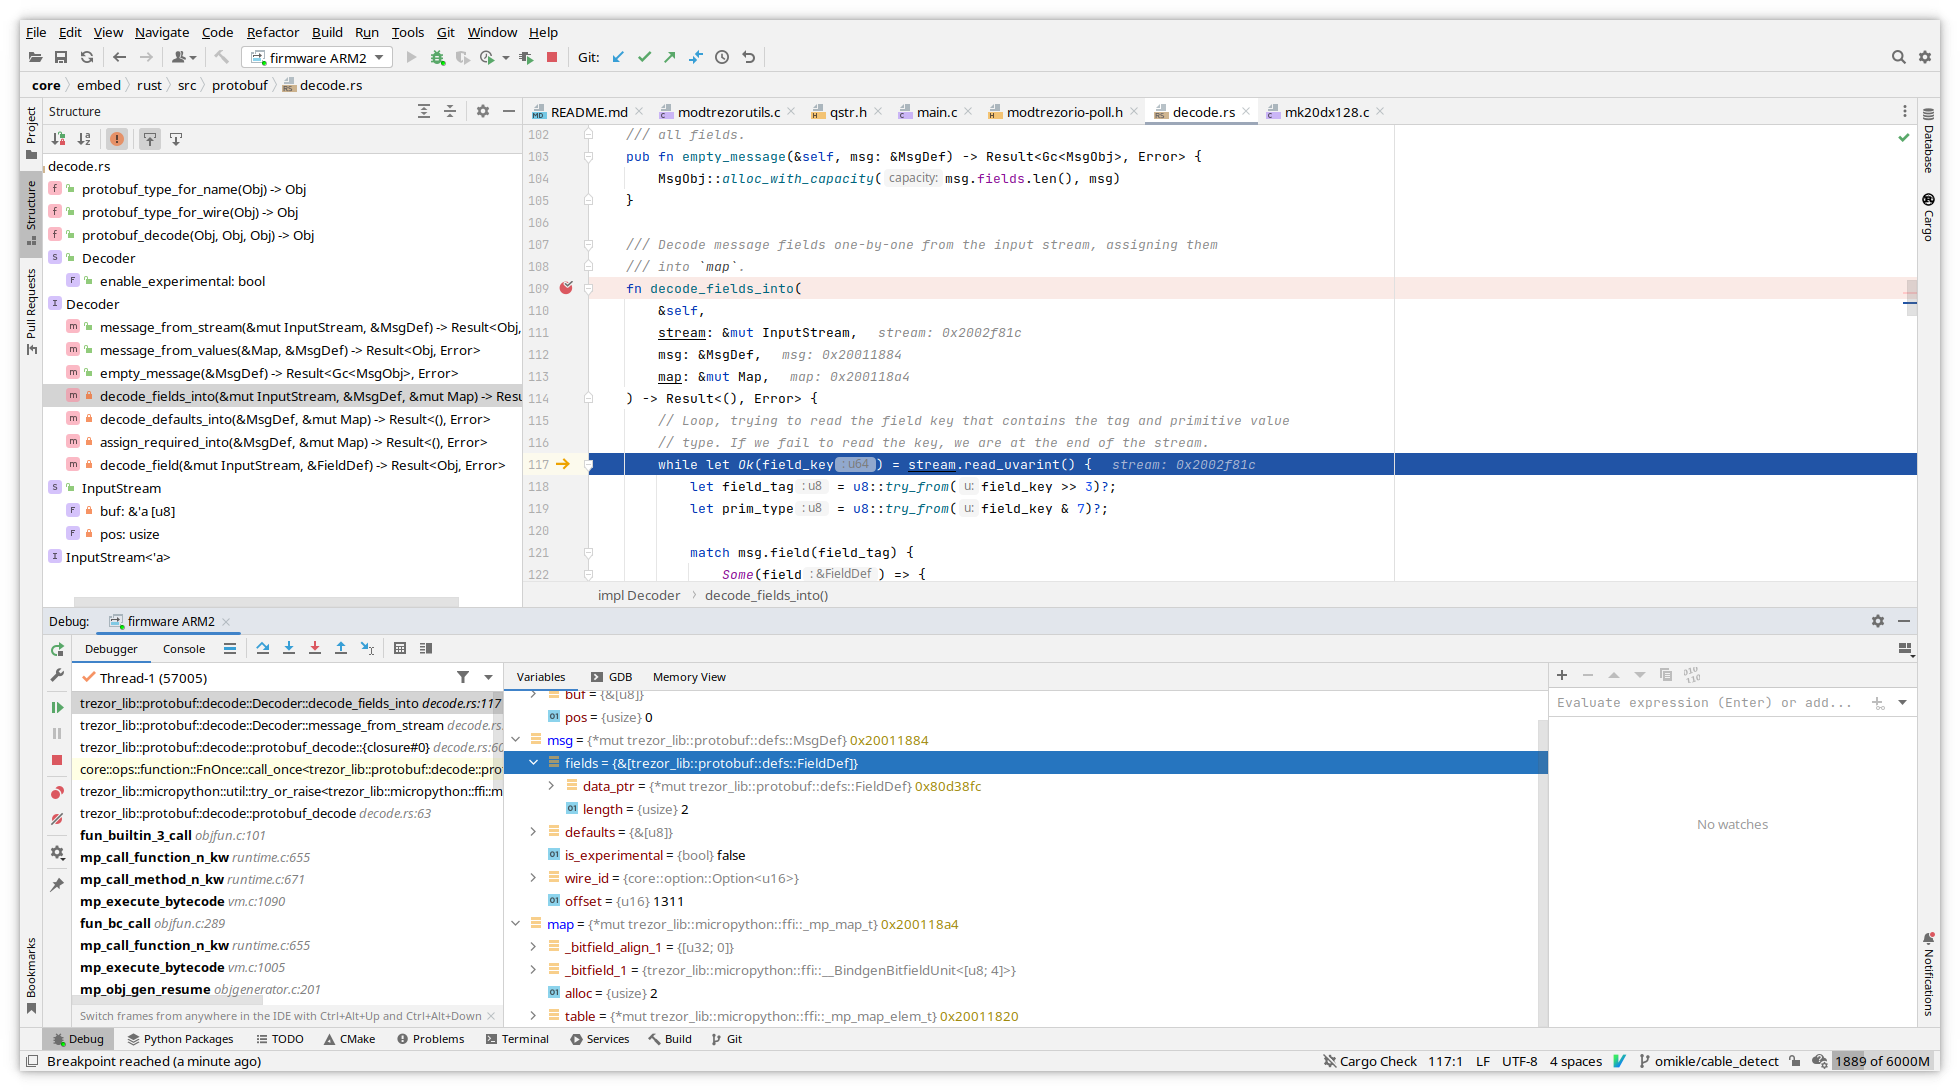
For pointers you can use memory view from variable's context menu.
Known limitations
Rust support is still in progress, so expect bugs sometimes.
Only way so far to get return value of function is to switch to GDB console and
use finish GDB command - unless you assign it to variable. GDB may not always show
it due to optimizations.
Not all trait info is output into debug info, so you will have issue with watching some expressions like this issue or this one.
Try not to put breakpoints on macro calls, since they may internally expand to too many addresses depending on inlining. This manifests when GDB will complain suddenly you have too many HW breakpoints or when JLink starts using flash breakpoints instead of just HW breakpoints.
Other ideas not thoroughly tested
You can define custom optimization level by choosing the -fxx options for C compiler and
similar ones for Rust with llvm-args that target LLVM passes.
Note that these change with compiler versions, LLVM 13 has
new pass manager.
The point would be to make a optimization level producing somewhat slower code, less inlining, but better debug experience.
Rust does not have equivalent of -Og level, this would be only way to make something similar.
The idea is generally to take an existing optimization level and change/remove some options that affect code size or optimize variables away, force them to stay in memory instead of registers. To look at what is used in passes you can print them out with:
llvm-as < /dev/null | opt -Oz -disable-output -debug-pass=Arguments
The -O0 level often generates too big code to fit in flash which is why this experiment
in customizing optimization level exists.
Additional notes on making CLion understand and parse code correctly
Note: Creating a project in CLion doesn't seem necessary for running debug like described above.
CLion remote debugger bindings will gather most information from debug info after connecting to external debugger (JLink or openocd GDB server), but it may be handy for general edit/completion/following definitions and so on.
Since we don't keep a CMakeLists.txt for core because everyone is using different
editor/IDE, here is a trick for creating it so that CLion will parse code without having
to run the debugger with debug info.
First, clone the repo and build both emulator and embedded code:
  make build_unix
  make build_embed
Now rename Makefile under core to something else, like Makefile.orig. Open the
core directory as new project in CLion.
Open any .c file, e.g. embed/projects/firmware/main.c.
At this point since CLion does not see Makefile or CMakeLists.txt, it will
suggest creating CMakeLists for you based on existing files.
Let it autogenerate one, then add following defines that are taken from build (there are more that should be added, but this suffices for most code including micropython stm32lib):
  add_definitions(
          -DFF_FS_READONLY=0
          -DFF_FS_MINIMIZE=0
          -DFF_USE_STRFUNC=0
          -DFF_USE_FIND=0
          -DFF_USE_FASTSEEK=0
          -DFF_USE_EXPAND=0
          -DFF_USE_CHMOD=0
          -DFF_USE_LABEL=0
          -DFF_USE_FORWARD=0
          -DFF_USE_REPAIR=0
          -DFF_CODE_PAGE=437
          -DFF_USE_LFN=1
          -DFF_LFN_UNICODE=2
          -DFF_STRF_ENCODE=3
          -DFF_FS_RPATH=0
          -DFF_VOLUMES=1
          -DFF_STR_VOLUME_ID=0
          -DFF_MULTI_PARTITION=0
          -DFF_USE_TRIM=0
          -DFF_FS_NOFSINFO=0
          -DFF_FS_TINY=0
          -DFF_FS_EXFAT=0
          -DFF_FS_NORTC=1
          -DFF_FS_LOCK=0
          -DFF_FS_REENTRANT=0
          -DFF_USE_MKFS=1

          -DSTM32_HAL_H=<stm32f4xx.h>

          -DTREZOR_MODEL=T2T1
          -DTREZOR_MODEL_T2T1=1
          -DSTM32F427xx
          -DUSE_HAL_DRIVER
          -DSTM32_HAL_H="<stm32f4xx.h>"
          -DAES_128 -DAES_192
          -DRAND_PLATFORM_INDEPENDENT
          -DUSE_KECCAK=1
          -DUSE_ETHEREUM=1
          -DUSE_MONERO=1
          -DUSE_CARDANO=1
          -DUSE_NEM=1
          -DUSE_EOS=1
          -DSECP256K1_BUILD
          -DUSE_ASM_ARM
          -DUSE_NUM_NONE
          -DUSE_FIELD_INV_BUILTIN
          -DUSE_SCALAR_INV_BUILTIN
          -DUSE_EXTERNAL_ASM
          -DUSE_FIELD_10X26
          -DUSE_SCALAR_8X32
          -DUSE_ECMULT_STATIC_PRECOMPUTATION
          -DUSE_EXTERNAL_DEFAULT_CALLBACKS
          -DECMULT_WINDOW_SIZE=8
          -DENABLE_MODULE_GENERATOR
          -DENABLE_MODULE_RANGEPROOF
          -DENABLE_MODULE_RECOVERY
          -DENABLE_MODULE_ECDH
          -DTREZOR_FONT_BOLD_ENABLE
          -DTREZOR_FONT_NORMAL_ENABLE
          -DTREZOR_FONT_MONO_ENABLE
          -DTREZOR_FONT_MONO_BOLD_ENABLE
  )

  include_directories(vendor/micropython)
  include_directories(build/firmware/genhdr/)
  include_directories(vendor/micropython/lib/stm32lib/STM32L4xx_HAL_Driver/Inc)
Rename the Makefile.orig back to Makefile. This is clumsy, but AFAIK there is no
explicit option to autogenerate CMakeLists.txt otherwise.
To make Rust code part of the project, right click embed/rust/Cargo.toml and
choose "Attach Cargo Project"